Numerical weather forecasting model ICON-CH1/2-EPS
MeteoSwiss uses two models, ICON-CH1-EPS and ICON-CH2-EPS, to forecast the atmospheric state in Switzerland and its surroundings over a longer period than nowcasting, providing predictions for up to five days. Both models include ensemble data assimilation, where multiple simulations with slightly perturbed initial conditions help account for forecast uncertainty. Forecasts can include the full ensemble or just the unperturbed control run.
The documentation covers the following topics:
- Getting started quickly
- Available data
- Download options
- Data structure
- Working with the forecast data
- FAQ/Troubleshooting
- Upcoming changes and changelog
Getting started quickly
Example notebooks: From retrieval to visualization
To get started quickly, explore the Jupyter notebooks, which provide hands-on examples for retrieving, processing, and visualizing numerical weather prediction (NWP) model data from MeteoSwiss.
Available data
24h availability window
Data made available through this interface is accessible for 24 hours only after its publication. After this window, it is no longer available for retrieval.
If your request returns an empty response or you encounter a 403 error, it likely means the data you're trying to access is older than 24 hours.
Models' specifications
| Attributes | ICON-CH1-EPS | ICON-CH2-EPS |
|---|---|---|
| Collection | ch.meteoschweiz.ogd-forecasting-icon-ch1 | ch.meteoschweiz.ogd-forecasting-icon-ch2 |
| Horizontal Grid Size | approx. 1 km | approx. 2.1 km |
| Ensemble Members | 11 | 21 |
| Forecast Period | 33 h | 120 h |
| Grid | Native icosahedral | Native icosahedral |
| Temporal Output Resolution | 1 h | 1 h |
| New Model Run (Initialization) | every 3 h | every 6 h |
| Output Data Format | GRIB edition 2 | GRIB edition 2 |
Available parameters
Each collection contains two parameter types: variable parameters and static parameters. Variable parameters describe time-dependent forecast quantities such as air pressure and temperature. Static parameters describe the model grid and surface characteristics for a given model run. For details about the static assets, see Model grid and static data.
Parameter overview
Moreover, each collection includes a downloadable CSV file with a continuously updated list of all available parameters. The file includes metadata such as:
- long name
- standard unit
- level type (single or multi level)
- vertical coordinate type
- temporal horizon
- aggregation type
- start time.
To access this file, open the collection page and download in the Asset section the file labeled “Overview of Parameters”. Available collections are:
Pollen data
The ICON-CH2-EPS control forecast also includes pollen concentrations. The pollen data is available exclusively
on the lowest full model level (model_level=80) representing the mean value
over approximately the first 20 m above ground. As pollen emission is a seasonal process,
each pollen type is only generated and present in the dataset during its
respective active flowering period, summarized in the table below.
| Pollen type | Variable | Season window* | Day of year |
|---|---|---|---|
| alder | ALNUsnc | Jan 8 – Mar 31 | 8 – 90 |
| ragweed | AMBRsnc | Jul 9 – Sep 30 | 190 – 273 |
| birch | BETUsnc | Mar 18 – May 25 | 77 – 145 |
| hazel | CORYsnc | Jan 8 – Mar 17 | 8 – 76 |
| grasses | POACsnc | Apr 1 – Aug 31 | 91 – 243 |
* For non-leap years; otherwise the day of year is used as the reference.
If a specific pollen variable cannot be found, it is likely that the corresponding pollen type is not currently in season. To verify which pollen parameters are currently available, please consult the parameter overview file mentioned above.
The same pollen variables are also available in the KENDA-CH1 analysis dataset. The KENDA-CH1 runs, initialized hourly, represent the best estimate of the pollen state at a past point in time.
For a practical example, see the Jupyter notebook, which demonstrates how to retrieve, convert and visualize pollen data.
Download options
- Using the Python API
- Using the REST API (HTTP POST)
- Manual download via STAC Browser
We recommend using MeteoSwiss's meteodata-lab library - a convenient tool to simplify accessing and working with numerical weather model data. The library supports downloading ICON-CH1/2-EPS GRIB2 data and loading it into xarray DataArray. It is particularly ideal for users who want a clean and easy way to integrate forecast data into Python workflows.
Users who prefer direct interaction with the REST API by issuing HTTP POST requests can retrieve datasets via the API endpoint. Following the step-by-step instructions in this section users can obtain forecast data for specific models, parameters, and other customizable variables.
Submitting a POST request
Filtering and querying forecast data must be done using a POST request. To retrieve a forecast, use a tool like curl and send the request to the API endpoint:
curl -X POST "https://data.geo.admin.ch/api/stac/v1/search" \
    -H "Content-Type: application/json" \
    -d '{
            "collections": [
                "ch.meteoschweiz.ogd-forecasting-icon-ch2"
            ],
            "forecast:reference_datetime": "2025-03-12T12:00:00Z",
            "forecast:variable": "TOT_PREC",
            "forecast:perturbed": false,
            "forecast:horizon": "P0DT00H00M00S"
        }'
Each parameter in the request body serves the following purpose:
collections: Defines the forecast or analysis model to retrieve (ch.meteoschweiz.ogd-forecasting-icon-ch1for ICON-CH1-EPS,ch.meteoschweiz.ogd-forecasting-icon-ch2for ICON-CH2-EPS andch.meteoschweiz.ogd-analysis-kenda-ch1for KENDA-CH1).forecast:reference_datetime: Specifies the desired forecast initialization time (e.g.,2025-03-12T12:00:00Z).forecast:variable: Indicates the meteorological parameter of interest (TOT_PRECfor total precipitation, for example).forecast:perturbed: Boolean flag determining if the request is for deterministic (false) or ensemble (true) data.forecast:horizon: Defines the forecast lead time to retrieve in ISO 8601 duration format (P0DT00H00M00Sfor data at +0h lead time, i.e. initialization).
Downloading the forecast data
Upon a successful request, the response will contain a dictionary of metadata, including forecast file links under the assets key. Locate the href field containing the pre-signed URL.
Download the GRIB file containing the forecast data using the following command:
wget -O <desired_filename> "<pre-signed URL>"
After downloading your forecast data, it's good practice to verify its integrity before use.
Verifying the data integrity
To ensure that the downloaded file is not corrupted, compute its SHA-256 hash and verify it against the checksum provided in the file's header field.
Steps:
- Open a terminal and generate the SHA-256 checksum of the downloaded file:
sha256sum <downloaded_filename>
- Retrieve the checksum from the file’s header field
x-amz-meta-sha256using the following command:
curl -s -i "<pre-signed URL>" | awk -F': ' '/x-amz-meta-sha256/ {print $0}'
- Compare the two hash values. If they match, your forecast data file is safe to use.
Once the file is verified, you can proceed with reading the GRIB file, using e.g. the instructions in Decoding GRIB files with ecCodes.
Accessing static grid information: Height, longitude, latitude and surface properties
❗ NOTE: Forecast GRIB files do not contain information about height, longitude and latitude. To geolocate or interpret vertical levels, you must use the static vertical and horizontal grid parameter files provided in each collection. 💡 Tip for new users: We recommend inexperienced GRIB file users to take a look at the provided Jupyter Notebooks. The data retrieval with the Python API includes fetching longitude and latitude.
In addition to the forecast files, each collection contains a vertical constants file and a horizontal constants file. See Static grid and surface files for their contents.
Accessing horizontal constants
To retrieve the horizontal constants, follow the steps below:
- Submit a GET request specifying the collection you want to download the static horizontal files from (eg.
ch.meteoschweiz.ogd-forecasting-icon-ch1for ICON-CH1-EPS).
curl -X GET https://data.geo.admin.ch/api/stac/v1/collections/ch.meteoschweiz.ogd-forecasting-icon-ch1/assets
- Locate the
hreffield underassetsinid: horizontal_constants_icon-ch1-eps.grib2and copy the pre-signed URL. - Download the file with:
wget -O <desired_filename> "<pre-signed URL>"
Before using any constants from the static file, verify that its uuidOfHGrid (Universally Unique Identifier for the horizontal grid) GRIB key matches the one in your forecast data. This ensures the horizontal grid definitions are consistent across files.
Accessing vertical grid parameters
In the static vertical file, the heights of the half levels of the vertical grid are provided in meters above mean sea level. In order to associate a value from a data file (for a given parameter) to a height in meters above sea level, follow the steps below:
- Submit a GET request specifying the collection you want to retrieve the static vertical files from (e.g.,
ch.meteoschweiz.ogd-forecasting-icon-ch1for ICON-CH1-EPS):
curl -X GET https://data.geo.admin.ch/api/stac/v1/collections/ch.meteoschweiz.ogd-forecasting-icon-ch1/assets
- Locate the
hreffield underassetsinid: vertical_constants_icon-ch1-eps.grib2and copy the pre-signed URL. - Download the file with:
wget -O <desired_filename> "<pre-signed URL>"
- Once the static GRIB file is downloaded, verify that the
uuidOfVGrid(Universally Unique Identifier for the vertical grid) key in the data file matches the one in the HHL file. - Retrieve the value for the
levelkey and inspect thetypeOfLevelkey by listing the GRIB messages:- generalVertical: The value of
levelcorresponds to a half level in the HHL file. For each level (i.e., each GRIB message), the variablehprovides the height in meters above sea level for every grid point. - generalVerticalLayer: The
levelvalue corresponds to a full level. To obtain the height in meters above sea level, average the heights of the two surrounding half levels (above and below). - Other types of level: These are usually specified directly in meters and are self-explanatory.
- generalVertical: The value of
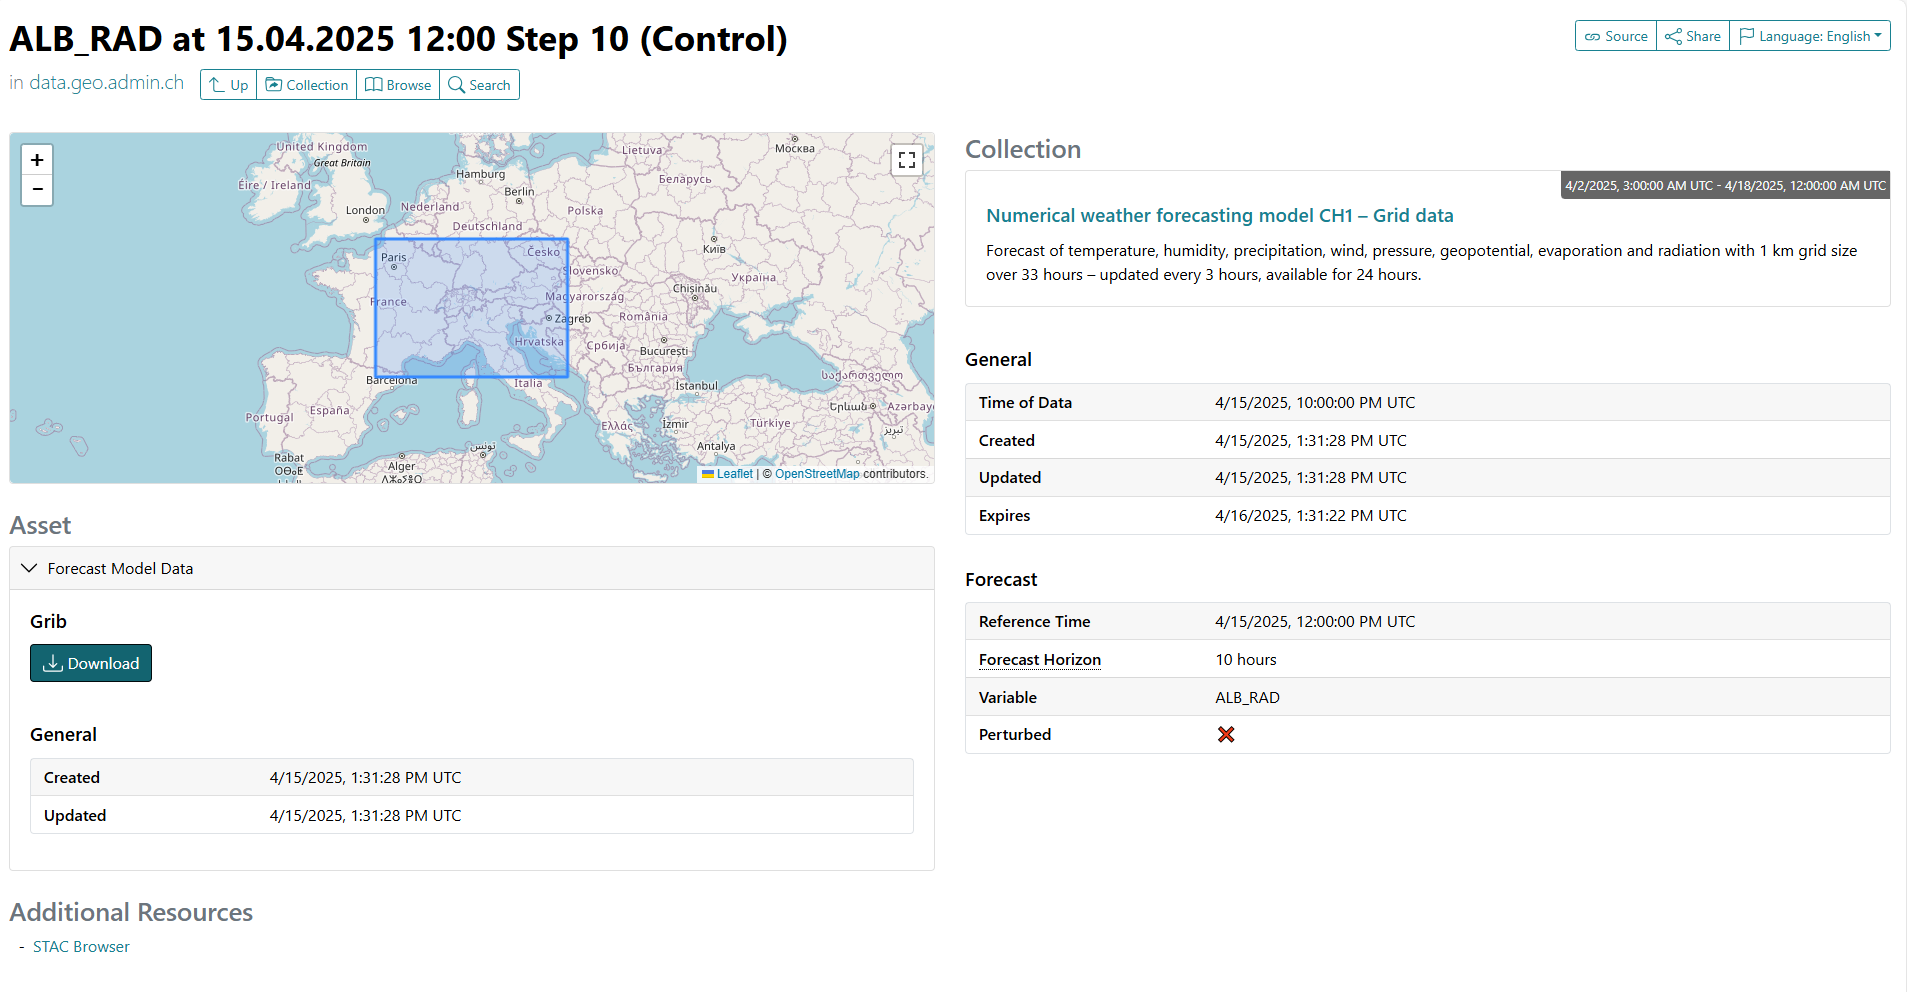
If users prefer to use a web interface to browse and download individual forecast GRIB files, they can use the STAC Browser for ICON-CH1-EPS and ICON-CH2-EPS.
The screenshot below shows the download option in the STAC Browser for the ALB_RAD parameter. Files are downloaded directly through the browser interface and saved to the default download location.
Data Structure
GRIB format
The data is provided in GRIB2 format, which is a binary format used internationally and defined by WMO. More information about the data format can be found in the Manual on Codes published by WMO.
⚠️ WARNING: Data located at the boundary of the spatial domain may be random.
GRIB file structure
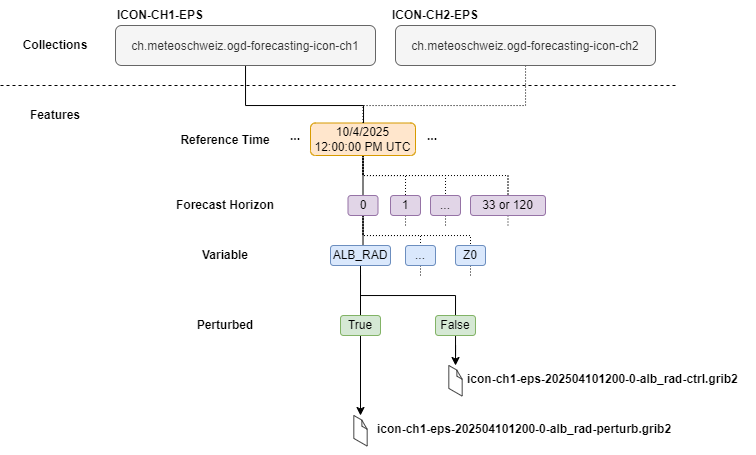
Each GRIB2 file contains data for a single model collection, one reference time, one forecast lead time, and one variable — either as the deterministic control run or the full ensemble. The following diagram shows a general overview.
Forecast data volume
The following tables summarize the expected volume of the different forecast files for ICON-CH1-EPS and ICON-CH2-EPS.
ICON-CH1-EPS Data Volume
| Single-Level Files | Multi-Level Files | |
|---|---|---|
| Deterministic | 199.0 Bytes - 2.2 MiB | 19.7 - 177.4 MiB |
| Perturbed | 1.9 KiB - 22.4 MiB | 197.1 MiB - 1.7 GiB |
ICON-CH2-EPS Data Volume
| Single-Level Files | Multi-Level Files | |
|---|---|---|
| Deterministic | 175.0 Bytes - 564.7 KiB | 4.9 MiB - 43.9 MiB |
| Perturbed | 3.4 KiB - 11 MiB | 97.5 MiB - 877.5 MiB |
Model grid and static data
The model data is structured on both a horizontal and vertical grid. Static parameters describing the grid and surface properties are provided in separate GRIB2 files.
Static grid and surface files
The static parameters remain fixed within a single model run. Each ICON collection provides two static files:
-
Vertical constants:
- HHL Geometric height of the layer limits above sea level, see the vertical grid documentation
-
Horizontal constants:
- CLAT Latitude of the center point coordinate of each triangle on the horizontal grid
- CLON Longitude of the center point coordinate of each triangle on the horizontal grid
- DEPTH_LK Lake depth
- FOR_D Deciduous forest fraction
- FR_ICE Sea ice fraction
- FR_LAKE Lake fraction
- FR_LAND Land cover indicator (1 for land, 0 for sea)
- HSURF Geometric height of the earth's surface above sea level
- LAI Leaf area index
- PLCOV Plant cover fraction
- ROOTDP Root depth
- SKC Skin conductivity
- SOILTYP Type of soil, based on the soilType.table
- SSO_GAMMA Sub-grid scale orography anisotropy
- SSO_SIGMA Sub-grid scale orography slope
- SSO_STDH Sub-grid scale orography standard deviation
- SSO_THETA Sub-grid scale orography direction
A universally unique identifier (UUID) is assigned to both horizontal and vertical constants, distinguished as uuidOfHGrid and uuidOfVGrid, to verify that the static data is consistent with the forecast data.
For a practical example of how to download static parameters in Python, refer to notebook 09_constant_parameters.ipynb.
When downloading variable parameters through the Python API, the corresponding horizontal coordinates (CLON, CLAT) are automatically included.
Currently, the collection assets are not versioned, so it is not possible to fetch previous versions of the static parameters. If you are creating an archive, you will need to keep track of the corresponding static files.
Vertical grid
The vertical grid above the surface is a height-based coordinate system that describes terrain-following model levels. The closer the levels are to the surface, the narrower the layers they define, as shown in the image below. The model levels gradually change into levels of constant height as the distance from the surface increases. Each grid box is delimited at the top and bottom by so-called half levels of the grid, while the full levels are aligned with the center of the grid box.
The vertical grid uses a Lorenz-type staggering, meaning that some parameters are defined at full levels and others, e.g. the vertical velocity W, at half levels.
There are 81 discrete half levels and 80 full levels in our data. The levels are numbered from top to bottom.
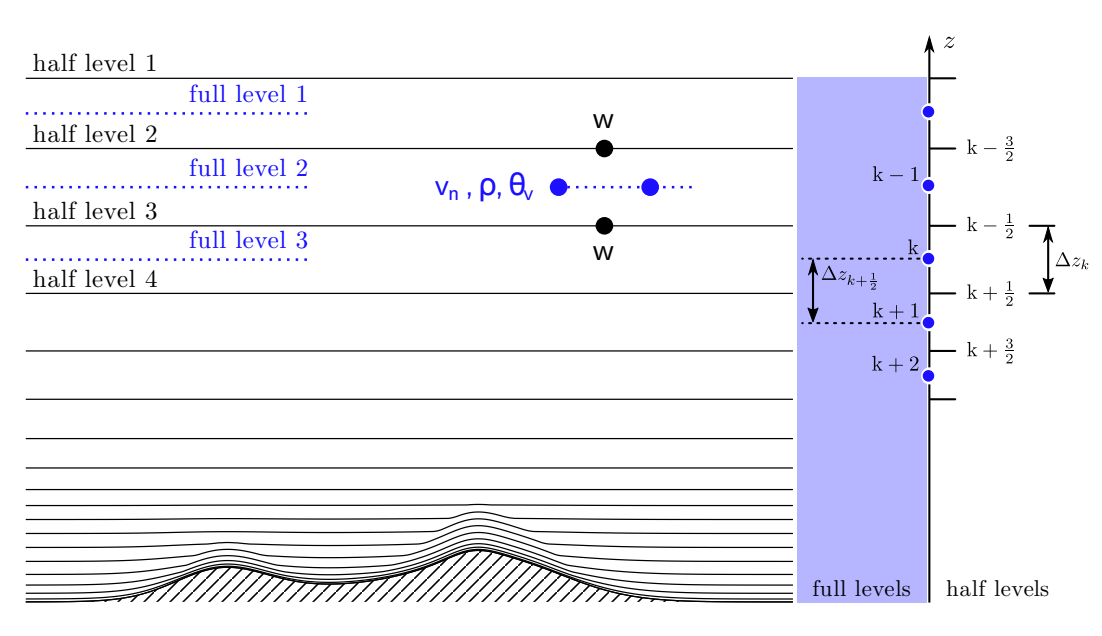
Illustration of ICON's vertical levels, Working with the ICON Model 2024, Figure 3.2
In addition to the vertical grid above the surface (half and full levels), there is also a grid below the land surface to describe parameters such as the soil temperature for example.
In the provided model data, some variables are also defined on a surface (e.g. total precipitation), or at a specific height above ground (e.g. temperature at 2m).
To determine the vertical positioning of a parameter and the units corresponding to the vertical surface type, inspect the GRIB2 key typeOfLevel:
-
generalVertical: half levels (-) -
generalVerticalLayer: full levels (-) -
depthBelowLandLayer: depth below surface (m) -
surface: ground or water surface (-) -
heightAboveGround: specific height above ground (m)
Parameters are classified as either single-level or multi-level:
- Single-level parameters contain data at a specific vertical level.
- Multi-level parameters span multiple vertical layers.
For more detailed information on the vertical grid, read section 3.4 in Working with the ICON Model.
Horizontal grid
The horizontal grid of the ICON-CH1-EPS and ICON-CH2-EPS models is based on a native icosahedral grid used by the ICON model (illustration below).
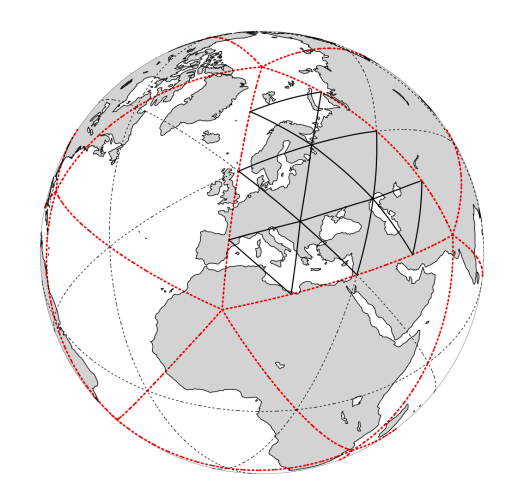
Illustration of the ICON grid structure, Working with the ICON Model, Figure 2.1
Since the provided data is defined on the native grid, the horizontal grid points correspond to the center of the circumcircle of each triangle and not to the triangle’s vertices. Therefore, the longitude and latitude information corresponds to the middle of each triangle. For more detailed information on the horizontal grid, read section 2.1 in Working with the ICON Model.
Working with the forecast data
Exploring GRIB files in Python
Several Jupyter Notebooks explain how to download and work with forecast files in xarray.DataArray format. To explore them, check out the GitHub repository opendata-nwp-demos.
Reading GRIB files using ecCodes
To work with GRIB files, you need a tool to decode the GRIB records. Each GRIB record holds the data for one parameter at one time and at one level. More information about the data format can be found in the Manual on Codes published by WMO. We recommend installing ecCodes from ECMWF to read the data. Follow the installation guide provided by ECMWF here.
Setting the local definitions of the COSMO consortium
The GRIB format relies on tables and templates to encode the metadata. Those tables allow for example the mapping of a triplet of numbers encoding a parameter to a descriptive string (shortName). The international tables are provided in ecCodes. Additionally,
local definitions can be defined by each center. ECMWF specific definitions are also shipped with ecCodes. Some of the provided ICON data also requires the local definitions of the COSMO consortium.
In order to provide a consistent and comprehensive set of GRIB tables, check the ecCodes version you installed and clone the
corresponding version of the GRIB tables in the same folder:
- Releases for COSMO-ORG/eccodes-cosmo-resources
- Releases for ecmwf/eccodes
Then, set GRIB_DEFINITION_PATH for ecCodes to use those tables (add it to your .bashrc to make if available in each terminal session):
export GRIB_DEFINITION_PATH=<name_of_your_folder>/eccodes-cosmo-resources/definitions:<name_of_your_folder>/eccodes/definitions
To check the details of your information, you can run
codes_info
Decoding GRIB files with ecCodes
This section provides a brief introduction to decoding GRIB files using command-line tools provided by ecCodes. There are also C, Fortran 90 and Python interfaces, please refer to the ecCodes documentation.
Please look up the use of the command-line tools in the ECMWF documentation.
Some useful commands are:
- List all the GRIB messages in a file:
grib_ls filename.grib
- Filter GRIB messages based on key-value conditions:
grib_ls -w key1=value1,key2=value2 filename.grib
- Specify a list of keys to be printed:
grib_ls -p key1,key2 filename.grib
- Get a detailed view of the content of all GRIB messages:
grib_dump filename.grib
- Get a detailed view of GRIB messages with filters:
grib_dump -w key1=value1,key2=value2 filename.grib
FAQ/Troubleshooting
How do I request the latest available forecast data?
Using the Python API:
You can use the special string "latest" as the ref_time (initialization time) in your request to automatically select the most recent available run for each asset.
For example:
from meteodatalab import ogd_api

req = ogd_api.Request(
    collection="ogd-forecasting-icon-ch2",
    variable="TOT_PREC",
    ref_time="latest", # Select the most recent available run
    perturbed=False,
    lead_time="P0DT0H",
)

tot_prec = ogd_api.get_from_ogd(req)
See concrete examples using "latest" in the notebooks: https://github.com/MeteoSwiss/opendata-nwp-demos. Be aware: during ongoing forecasts publication, requesting multiple timesteps or parameters may return assets with different ref_time values, as assets are not published all at once.
Using the STAC Browser:
The STAC Browser does not show the newest items first. To find the most recent data, you may need to manually click through pages. For easier access, consider using "latest" as shown above.
Why can't I find the latitude or longitude coordinates?
Raw forecast GRIB files loaded via the REST API do not contain information about height, longitude and latitude. To geolocate or interpret vertical levels, you must use the static vertical and horizontal grid parameter files provided in each collection. For more information, refer to notebook 09_constant_parameters.ipynb or read section Accessing static grid information: Height, longitude, latitude and surface properties.
Why is my HTTP response empty?
The data provided in the two collections described in the Model specifications table is accessible for only 24 hours. Data older than this is no longer available, which may be why your HTTP response is empty.
Why do I get HTTPError: 403, when downloading forecast data using the Python API?
The data provided in the two collections described in the Model specifications table is accessible for only 24 hours. Data older than this is no longer available. Therefore, when attempting to fetch unavailable data, HTTPError: 403 occurs.
How do I interprete the different types of vertical levels?
To determine the type of level (vertical position) of a parameter, inspect the GRIB2 key typeOfLevel. We distinguish between the following:
-
generalVertical: half levels (-) -
generalVerticalLayer: full levels (-) -
depthBelowLandLayer: depth below surface (m) -
surface: ground or water surface (-) -
heightAboveGround: specific height above ground (m)
For more details, refer to section Vertical grid.
How can I access KENDA analysis data?
Analysis data generated by KENDA is available through the Open Data interface. For more details, see Numerical weather analysis KENDA-CH1.
Alternatively, you can use the forecast data of ICON-CH1-EPS or ICON-CH2-EPS at lead time 0 (horizon 0), which provides fields equivalent to the analysis.
These are available every 3 hours (ICON-CH1-EPS) or 6 hours (ICON-CH2-EPS), instead of hourly as with KENDA.
Upcoming changes and changelog
Here you will find information about upcoming changes and the changelog.